What you need to know about the retirement income system in Ontario, including how it works, challenges for the future and what you can do to help maintain your standard of living in retirement.
Evidence shows that many Ontarians are not saving enough to maintain their standard of living in retirement. Beyond the statistics, many feel insecure and uncertain about their financial future.
It’s important to learn how the retirement income system works, so that you and your family can have the retirement security you deserve.
The Canadian retirement income system is typically described as having three parts:
These combine to fund your retirement, but the importance of each one may differ depending on your personal circumstances.
Retirement experts suggest that households should aim to have 50-70% of their pre-retirement income for living expenses in retirement.
For example, assuming you want to replace 70% of your pre-retirement income:
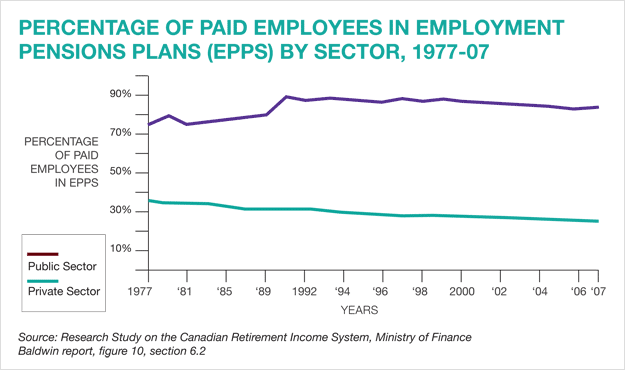
The number of workers enrolled in a workplace pension plan is steadily declining, and personal savings by Ontarians have decreased over the past 30 years.
This graph compares the percentage of private sector and public sector employees enrolled in Employment Pension Plans ( EPPs ) from 1977 through 2008. Public sector employees are represented by a red line in the top third of the graph and private sector employees are represented by a teal-coloured line near the bottom third of the graph. The graph illustrates that the percentage of paid employees enrolled in Employment Pension Plans in the private sector went from roughly 35 per cent in 1977 to 25 per cent in 2008. In contrast, the graph shows that the percentage of paid employees enrolled in Employment Pension Plans in the public sector went from roughly 75 per cent in 1977 to roughly 83 per cent in 2008. Source: Research Study on the Canadian Retirement Income System, Ministry of Finance, Baldwin report, figure 10, section 6.2
For households not contributing enough to their personal savings (see Table 1 below), this means:
Other pension challenges we will face in the future include:
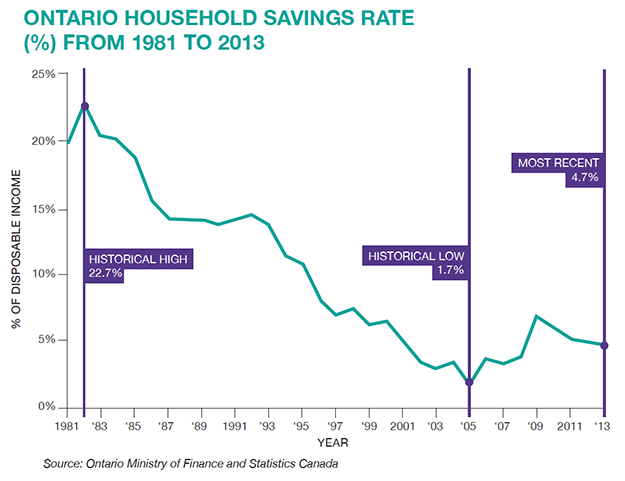
This graph illustrates the decline in the Canadian household savings rate from 1981 to 2013.The graph compares what percentage of disposable (after tax) income Canadians saved every year from 1981 to 2013. The graph highlights three major points in the Household Saving Rate since 1981. The first point is in 1982, when the household savings rate was at a historical high of 18.8 per cent. The second point is the historical low of 1.5 per cent in 2006. The third point is the most recent release of the household savings rate in 2013, at 5.2 per cent. Although the household savings rate has increased slightly over the past decade, this graph shows that Canadian household savings have been declining over the past 30 years. Source: Statistics Canada Table 380-0072